From question to report in one step
Reporting is where most produce businesses lose the most time to manual work. Someone runs a standard report, exports it, deletes columns, builds a pivot table, makes a chart, pastes it into an email and sends it. By the time it arrives, the figures are hours or days old, and the first reply is usually a follow-up question that starts the whole process again.
Pak-Bot replaces that chain with a single request. The Pak-Bot guide calls it "instant ad hoc reports at any time": a report built for your question, at the moment you ask it, from live Producepak data. This page shows how to create tables and charts, how to send them, and how to make reporting a routine rather than a chore.
How to get a table
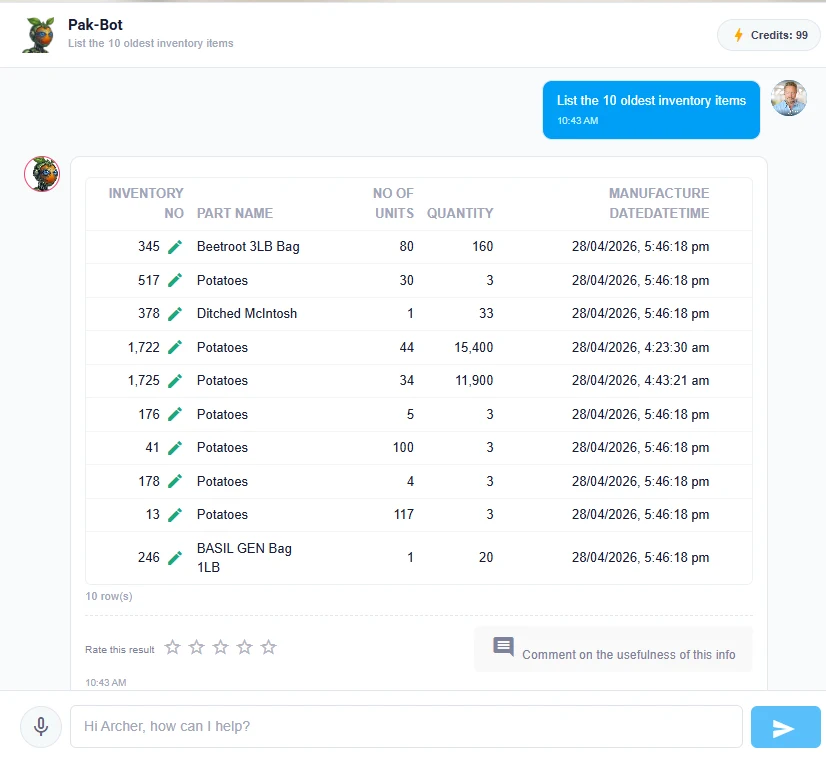
Tables are the right format when you need detail: individual pallets, orders, inspections or customers.
- Start with "List", or name the detail you want: "the 10 oldest inventory items", "open orders for tomorrow".
- Add a limit if the list could be long: "top 10", "the 20 largest".
- Check the row count shown under the table.
How to get a chart
Charts are best for comparison and trend. To get one:
- Start the request with "Chart".
- Name the measure and the grouping: "sales by customer", "stock by site".
- Limit the categories if there are many: "top five customers".
- Read the table underneath to confirm exact values.
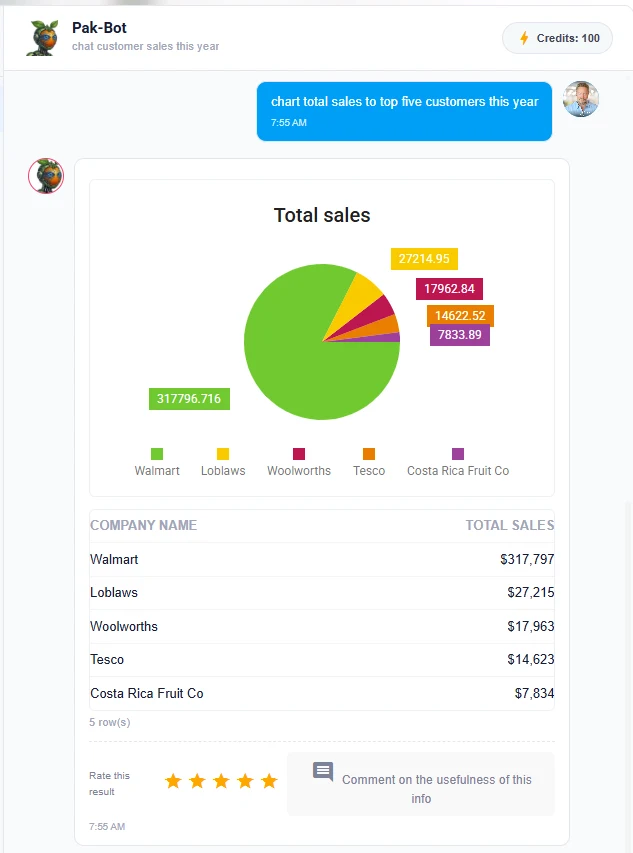
The example in the Pak-Bot guide is chart total sales to top five customers this year. It returns a pie chart titled Total sales with a legend, and a table of company names and totals below.
Choosing the chart type
| You want to show | Ask for | Example |
|---|---|---|
| Share of a total | a pie chart | "Chart stock by owner" |
| Comparison across categories | a bar chart | "Bar chart of sales by state last month" |
| Change over time | a line chart | "Line chart of weekly sales to Loblaws this year" |
If the chart is not quite right, change it with a follow-up: "as a bar chart", "by month", "only the top three".
How to email a result
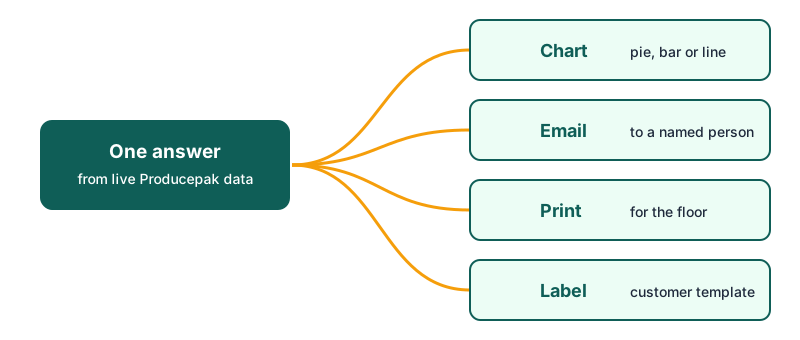
Any answer can be emailed. There are two ways to do it.
Ask and send in one request
Put "Email" and the recipient at the start: Email Angela Coles sales from Q1. Pak-Bot runs the question and sends the result.
Check first, then send
Ask the question, look at the answer, then ask Pak-Bot to email it. This is the better habit for anything going outside the business, such as a grower update or a customer summary.
Emails follow the permissions of the person asking. If you cannot see sales data, you cannot email it.
How to print
Printing works the same way: "Print the 10 oldest inventory items", "Print orders for delivery tomorrow by customer". Printouts suit people who work away from screens, such as forklift drivers, pickers and packing line leads. Ask your administrator which printers are available from your device.
Building a weekly report pack
Most businesses have a weekly report that takes someone half a day. With Pak-Bot it can be a list of requests that anyone with the right access can run in a few minutes.
Example weekly pack
- Total sales last month (or last week)
- Sales by state last month
- chart total sales to top five customers this year
- Walmart orders vs sales Q1 2026 (each key customer)
- List the 10 oldest inventory items
- Weight of totes in stock
Run each request, check it, and email it to the management group. Because every answer comes from live data, the pack is current at the moment it is sent.
Reports for people outside the business
Growers
Stock owned, yield by lot and quality results, emailed weekly. Totals of inventory owned by ACE Farming Group is the starting point.
Customers
Delivery summaries and fill rates, shared before supplier reviews. Check every figure on screen before sending.
Auditors
Summaries of inspections and corrective actions over a period, with formal records drawn from Producepak's standard reports.
Checking report accuracy
A fast report is useless if nobody trusts it. Build trust with three habits:
- Read the table, not just the chart. The values are there for checking.
- Test against a known figure. Early on, compare a Pak-Bot total with a standard Producepak report for the same period.
- Use the feedback controls. Rate answers and comment when something is off, so the team can train Pak-Bot.
For financial statements and formal documents, confirm figures against standard reports or the accounting system. Use Pak-Bot for the fast, everyday questions that drive operational decisions.
Eight report recipes
Each recipe is a short sequence of requests that produces a useful report. Change the names and periods to suit your business.
1. Monthly sales summary
- Total sales last month
- "Sales by customer last month"
- "Email it to the management team"
2. Customer concentration check
- chart total sales to top five customers this year
- "Same chart for last year" to compare
3. Regional sales for logistics
- Sales by state last month
- "As a bar chart"
- "Email it to the logistics manager"
4. Retailer fill-rate brief
- Walmart orders vs sales Q1 2026
- "Which products were short-shipped?"
- "Email it to me" before the supplier review
5. Product performance for a key account
- Woolworths sales of baby spinach this year
- "By month"
- "As a line chart"
6. Stock age sheet for the floor
- List the 10 oldest inventory items
- "Print it"
7. Packing plan inputs
- Weight of totes in stock
- "Orders for delivery tomorrow by product"
8. Grower stock update
- Totals of inventory owned by ACE Farming Group
- "By product"
- "Email it to the grower contact" after checking
Comparisons that stay fair
Many reports compare periods, customers or products. A few rules keep comparisons honest:
- Complete periods. Comparing a part month with a full month exaggerates differences.
- Same measure. Compare value with value and weight with weight; mixing them hides price changes.
- Seasons by date. For crops whose season crosses the new year, give explicit dates.
- Like customers. Compare retail with retail and food service with food service; order patterns differ.
When to use standard reports instead
Pak-Bot is built for ad hoc questions. Formal, repeatable documents are still best produced by Producepak's standard workflows and reports:
| Use Pak-Bot for | Use standard Producepak reports for |
|---|---|
| Quick questions and follow-ups | Invoices and statements |
| Charts for meetings | Bills of lading and export documents |
| Lists for the floor | Formal traceability and recall records |
| Emails to colleagues and growers | Figures going into financial statements |
Sharing etiquette
When reports are this easy to send, a few team rules help:
- Agree who sends each regular report, so recipients do not get three copies.
- Send totals or charts rather than long lists unless the detail is needed.
- Write clear requests so the email explains itself.
- Always check external emails on screen first.
Reading a chart properly
Charts make patterns obvious, but they can also mislead if read too quickly. A few checks help:
- Look at the totals in the table. A slice that looks large on a pie chart may still be a small amount of money.
- Check the period. Make sure the chart covers the dates you meant.
- Watch for one dominant category. When one customer or product dwarfs the others, the smaller ones can look identical. Ask for a second chart without the largest category if you need to compare the rest.
- Count the categories. More than seven or eight slices or bars are hard to read; ask for the top five or top ten.
In the top-five example in the Pak-Bot guide, one customer accounts for most of the year's sales. The chart shows that instantly; the table shows exactly how far ahead it is.
From one-off answers to a reporting habit
The real gain from AI reporting comes when people stop waiting for scheduled reports and start asking when a question arises. To build that habit:
- Pick the three reports your team requests most often and replace each with a Pak-Bot recipe.
- Share the recipes, with your own names, in the team's prompt list.
- Encourage people to ask a follow-up whenever an answer raises a question.
- Review after a month which recipes are used and which are not, and adjust.
Within a few weeks, most recurring report requests disappear, and the people who used to prepare them have time for work that needs their experience.
Reports by role
| Role | Most useful report | Format |
|---|---|---|
| Owner | Top five customers this year | Pie chart, emailed monthly |
| Sales manager | Orders vs sales by key customer | Table before reviews |
| Logistics | Sales by state last month | Bar chart |
| Warehouse | Ten oldest inventory items | Printed table each shift |
| Grower liaison | Stock owned by each grower | Emailed weekly |
Reports for meetings
Meetings go better when the numbers are already on the table. Before a weekly operations meeting, the chair can ask for four or five answers, check them and email them to attendees. During the meeting, follow-up questions can be asked on the spot: if someone asks why sales fell in one state, ask Pak-Bot "sales by customer in that state last month" and look at the answer together. Decisions that used to wait for "we'll pull the numbers and come back next week" can be made in the room. After the meeting, email the final charts to everyone who needs them so the decisions and the figures behind them stay together.
Saving your best requests
Every team develops favourite requests: the Monday sales check, the shift-start stock list, the weekly grower email. Write them down in a shared list with the exact wording that works, the person who runs each one and who receives the result. When someone is away, a colleague can run the same requests and send the same reports without having to rebuild anything. New starters can pick up the reporting routine on their first day. Review the list each season, because customers, products and priorities change, and the requests that matter in peak season may differ from the ones that matter in the quiet months.
Report and chart questions
Can I get a chart and the exact numbers?
Yes. Charts are shown with the table of values used to draw them.
Can I email a report to someone outside the business?
Yes. Check the answer on screen first, then ask Pak-Bot to email it.
Are the reports live?
Yes. Each request runs against current Producepak data.
Can I print a report for the packing floor?
Yes. Ask Pak-Bot to print the result, for example "Print the 10 oldest inventory items".