
Business intelligence without the dashboard project
Business intelligence (BI) usually means dashboards: a data model, a set of charts and a team to keep them working. For large corporations that model is fine. For a produce business with a lean office, it often fails quietly. The dashboards are built, used for a few months, then drift out of date as products, customers and priorities change. Meanwhile the questions that actually come up each week, the one-off ones, still end up as spreadsheet exports.
Natural-language BI takes a different route. Instead of predicting which questions people will ask and building a chart for each, it lets people ask whatever they need, and builds the answer on demand. Pak-Bot brings that approach to fresh produce. A manager types Sales by state last month and gets a breakdown; adds "as a chart" and gets a chart; adds "compared with the same month last year" and gets a comparison. No dashboard was designed in advance.
The KPIs that matter in fresh produce
Generic BI tools are built for generic businesses. Produce has its own measures, and they determine whether a season is profitable. Here are the ones most worth tracking, with questions that bring them up.
| KPI | Why it matters | Ask |
|---|---|---|
| Packout (first-grade yield) | Converts intake into saleable product; the biggest driver of packing margin | Packout by grower this month |
| Waste percentage | A direct cost and a sustainability measure | Waste by product last quarter |
| Stock age | Older stock sells for less or not at all | List the 10 oldest inventory items |
| Fill rate | Retailers judge suppliers on it | Walmart orders vs sales Q1 2026 |
| Customer concentration | Dependence on a few buyers is a business risk | chart total sales to top five customers this year |
| Sales by region | Drives freight and route planning | Sales by state last month |
| Rejection rate | Measures supplier quality and claim risk | Rejection rate by supplier this quarter |
| Stock by owner | Essential for consignment and grower reporting | Totals of inventory owned by ACE Farming Group |
Anatomy of an analytical question
Pak-Bot understands loose language, but analytical questions get sharper answers when they contain five ingredients.
- Output: total, list, chart or comparison.
- Measure: sales value, units, kilograms, orders, packout percentage, rejection rate.
- Filter: a customer, product, grower, supplier, site or packaging type.
- Grouping: by customer, by product, by week, by site, by grower.
- Period: yesterday, last week, Q1 2026, this season, a date range.
"Chart avocado sales by customer by week this season" contains all five. Short questions are fine too; Pak-Bot fills reasonable defaults. If the first answer is not quite what you wanted, refine it with a follow-up such as "only the top three customers" or "as a bar chart".
Charts on demand
Every chart Pak-Bot draws is accompanied by its table, so the exact figures are always visible. Choosing the right chart type makes the answer clearer.
Pie
Share of a whole: sales by customer, stock by owner, inventory by product group.
Bar or column
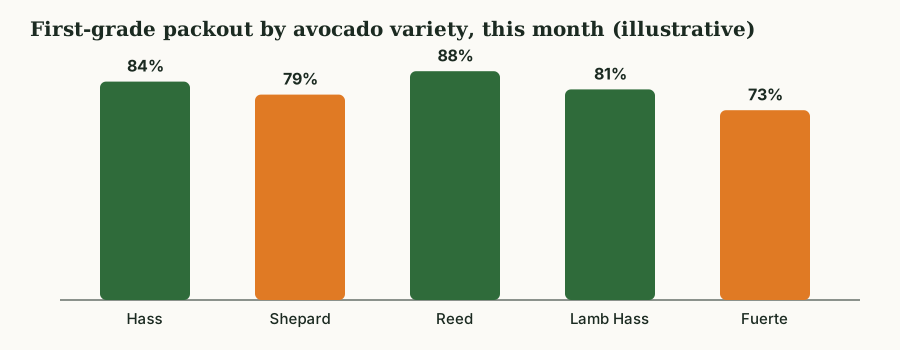
Comparing categories: packout by variety, rejection rate by supplier, sales by state.
Line
Change over time: weekly sales of a product, monthly waste, daily packing volume.
Table
Detail: the oldest stock, short-shipped orders, inspection results for a lot.
From one number to a root cause
The real value of natural-language analytics is the follow-up. Each answer suggests the next question, and asking it costs seconds. Consider an illustrative investigation that starts with a disappointing month:
- Total sales last month compared to the month before: sales fell.
- Sales by customer last month compared to the month before: most of the fall is one retailer.
- That retailer's orders vs sales last month: orders held steady but shipments fell short.
- Products short-shipped to that retailer last month: one product line accounts for most of the gap.
- Packout for that product by week last month: packout dropped in two weeks.
- Rejection rate by supplier for that product in those weeks: one supplier's rejections spiked.
Six questions trace a sales problem back to a supply problem. With traditional reporting, that chain would take days and several people. Because Pak-Bot reads one connected database covering sales, orders, inventory, packing and quality, it can follow the chain in minutes.
Comparisons and periods
Most business questions are comparisons: this week against last, this season against last season, one customer against another. A few habits keep comparisons fair.
- Compare complete periods. Month-to-date against a full month exaggerates declines. Compare the same number of days or wait for the period to close.
- Use seasons for seasonal products. Calendar years split a season in two for many crops. Ask for "this season compared with last season" with explicit dates if needed.
- Be clear about measures. Value, weight and units can tell different stories when prices move.
- Watch for credits. Decide whether you want sales before or after credits before comparing with accounting figures.
Dashboards and chat together
Natural-language BI does not make dashboards obsolete. Numbers that are watched all day, such as today's open orders or dispatch progress, are best on a screen that is always visible. Producepak includes logistics, sales and profit dashboards for that purpose. The chatbot covers everything else: the hundreds of questions that are asked once, or occasionally, and that nobody would build a dashboard for.
| Use a dashboard when... | Use the chatbot when... |
|---|---|
| The same number is watched many times a day | The question is new or occasional |
| Many people need the same view | One person needs a specific slice |
| The layout rarely changes | The follow-up depends on the first answer |
Trust and accuracy
Business intelligence is only useful if people believe it. Pak-Bot earns trust in three ways. The figures come from queries against Producepak records, not from the language model guessing. Tables are shown with charts, so values can be checked. And every answer has a rating and comment box, so misreadings are reported and corrected by the Producepak team. For figures going into financial statements, confirm against standard reports or the accounting system.
Sharing analysis
Analysis matters when it reaches decision-makers. Any Pak-Bot answer can be emailed or printed. A general manager can send a weekly pack of four or five charts to the leadership team directly from the chat, and each recipient sees a result built from the same live data. Permissions still apply: Pak-Bot will only retrieve data the person asking is allowed to see.
Weekly BI pack for a produce business
- Total sales last week compared to the week before
- chart total sales to top five customers this year
- Orders vs sales by customer last week
- Packout by line last week
- Waste by product last week
- Chart inventory weight by site
Seasonality: the produce analyst's biggest trap
Most business intelligence assumes that this month can be compared with last month. In produce, that assumption breaks constantly. Volumes and prices swing with the season, the weather, import windows and retail promotions. A fall in sales from March to April may be completely normal for a crop whose season is ending. A rise may simply be a promotion week.
The fix is to compare like with like. Ask for this season against last season over the same weeks, or this week against the same week last year. Pak-Bot handles explicit date ranges, so "sales of red onion from 1 March to 30 April this year compared with the same dates last year" is a fair comparison. For crops whose season crosses the calendar year, define the season by dates rather than by year.
Promotions
Retail promotions distort weekly sales sharply. A line chart of weekly sales to a retailer shows promotion peaks clearly. When reviewing a period that included a promotion, look at the weeks either side as well, because demand often dips after a promotion as shoppers work through what they bought.
Weather and supply
Sometimes sales fall because supply fell. Checking intake and packout for the same period, as in the root-cause example above, separates demand problems from supply problems.
Unit economics for produce
Produce margins are thin, and they are made or lost per kilogram. Whenever the data is recorded in Producepak, useful per-unit views include:
- Average selling price per kilogram or carton by product, customer and week.
- Sales value per kilogram received by grower, combining packout and price into a single measure of what each grower's product is worth to the business.
- Waste per tonne packed by line or product.
- Revenue per order by customer, which shows whether small frequent orders are worth their handling cost.
These measures depend on prices and costs being recorded consistently. Where they are, the chatbot can produce them for users with the right access; where they are not, they are a good reason to tighten data capture.
Customer analytics beyond the top five
The top-five chart is a starting point. Deeper customer questions help a sales team decide where to spend time.
- Customers whose sales grew this year
- Customers who have not ordered in 30 days
- Average order size by customer this year
- Products bought by Costa Rica Fruit Co this year
- New customers this quarter
Growing customers deserve attention to keep them growing. Lapsed customers deserve a call. Customers with small average orders may be candidates for minimum order quantities or delivery consolidation. Product mix by customer reveals cross-selling opportunities: a customer buying tomatoes and cucumbers but not peppers may simply not have been asked.
Operational analytics
Analytics is not only for the boardroom. Operational managers benefit as much from quick answers.
| Manager | Question | Decision it supports |
|---|---|---|
| Packing | Packout by line last week | Grader calibration, training, maintenance |
| Warehouse | Chart inventory weight by site | Transfers between sites, cool room space |
| Quality | Rejection rate by supplier this quarter | Supplier conversations and buying decisions |
| Logistics | Sales by state last month | Route and freight planning |
| Purchasing | Top 10 suppliers by weight received this year | Supplier programs and negotiations |
Reporting to owners and boards
Owners and boards want a small number of reliable measures, presented consistently, with the ability to ask a follow-up. A monthly pack built from chatbot questions meets that need: the same six or eight charts each month, each with its table, emailed from the same conversation. When a board member asks why a figure moved, the follow-up question can be asked on the spot rather than taken away as an action. The underlying data is the same live data the operation runs on, which removes debates about whose spreadsheet is right.
Data quality: the foundation of good analytics
No analytics tool, AI or otherwise, can fix data that was captured badly. The most common data quality issues in produce are inconsistent product names, missing lower-grade and waste records, stock movements that were not scanned and credits recorded without reasons. Each one distorts a different KPI: names affect sales by product, missing waste records inflate packout, unscanned movements distort stock and fill rate, and unexplained credits hide margin problems. Fixing them is ordinary operational discipline, and it makes every chatbot answer more reliable.
Good data, asked the right questions, turns a produce business's records into its most useful planning tool. The chatbot makes asking cheap; disciplined data capture makes the answers worth having.
Business intelligence questions
Do we need a data warehouse to use the chatbot?
No. Pak-Bot reads Producepak's operational records directly.
Is the data live?
Yes. Each question runs against current Producepak data.
Can I get a chart and the numbers together?
Yes. Charts are shown with the table of values used to draw them.
Does it replace dashboards?
No. Dashboards suit numbers watched constantly; the chatbot suits new and occasional questions. Producepak provides both.
Who can see sales analysis?
Only employees whose role allows sales data. Answers are also filtered by site.